
Landian Market Report · September 2026
For-Sale-by-Owner Listings Are Up 10% Since Spring. Except in Florida.
September 26, 2026 · Landian · The Landian FSBO Index
Key findings
- Owner-listed homes are up 9.5% across the US since April on a like-for-like basis (12,483 to 13,666 active FSBO listings priced $400K+ across 51 jurisdictions). With Canada included, the index is up 10.3%.
- The growth is where sellers still hold the cards. New York (+19.7%), New Jersey (+17.0%), Michigan (+29.1%), Illinois (+18.4%) and Virginia (+18.4%) all posted double-digit gains; Maine (+72%), Wisconsin (+65%) and Vermont (+56%) grew fastest from small bases.
- Florida, the largest FSBO state, fell 12.6% over the same period, mirroring the double-digit inventory drop that Florida Realtors attributes to sellers withdrawing listings.
- The pool stopped growing in September. On the 31 states tracked continuously since August, FSBO inventory slipped 0.6% month over month as the 30-year mortgage rate crossed 7%.
- Owners in this segment are asking a median $589,000 (669 listings captured in the last 30 days), from $737,000 in California to $472,500 in Kansas.
The week the 30-year mortgage rate crossed 7% for the first time in 20 months, Redfin was reporting the widest gap between home sellers and buyers it has ever measured, and Florida Realtors was explaining a double-digit drop in the state’s inventory with a single phrase: sellers withdrew their listings. Underneath those headlines is a quieter decision that hundreds of thousands of homeowners make each year, and that almost nobody tracks in real time: whether to sell the house themselves.
The Landian FSBO Index does track it. Every day since March 31, 2026, Landian’s coverage monitor has counted the for-sale-by-owner listings priced between $400,000 and $4 million that Zillow shows in every US state, the District of Columbia, Puerto Rico and each Canadian province and territory. This is the first monthly edition, and it shows a market that is splitting in two.
Owners are going it alone where sellers still have leverage
Nationally, the index rose 9.5% between April and September on the 51 US jurisdictions observed in both months, from 12,483 owner-listed homes to 13,666. Add Canada’s 13 provinces and territories, up 27.7% to 735 listings, and the North American index is up 10.3%.
The increase is not evenly spread. It is concentrated in the Northeast and Midwest, the same regions where Realtor.com’s August Housing Report found inventory rebuilding fastest (Midwest +10.5%, Northeast +9.1% year over year) and where prices are still rising while the Sun Belt softens. New York’s FSBO count grew 19.7%, New Jersey’s 17.0%, Michigan’s 29.1%, Illinois’s 18.4%. The fastest growth of all came from small New England markets: Maine (+72%), Vermont (+56%) and New Hampshire (+32%), with Wisconsin (+65%) and Delaware (+36%) close behind.
The pattern is intuitive once you see it. In a market where homes still sell in weeks and buyers still compete, the listing largely sells itself, and a homeowner weighing a 2.5% to 3% listing commission on a $600,000 house is weighing $15,000 to $18,000. The tighter the market, the more attractive it is to try.
| Jurisdiction | Active FSBO listings | Since April |
|---|---|---|
| Florida FL | 1,201 | −12.6% |
| New York NY | 1,118 | +19.7% |
| California CA | 1,113 | +19.8% |
| Texas TX | 944 | +5.6% |
| Ontario ON | 674 | +30.6% |
| North Carolina NC | 627 | +2.8% |
| New Jersey NJ | 587 | +17.0% |
| Georgia GA | 460 | +1.7% |
| Tennessee TN | 402 | +10.7% |
| Michigan MI | 380 | +29.1% |
| Virginia VA | 379 | +18.4% |
| Missouri MO | 342 | +12.5% |
| Alabama AL | 316 | −5.5% |
| Illinois IL | 310 | +18.4% |
| Kentucky KY | 274 | +9.8% |
September value is the average of daily counts through September 26. Change is measured against the April 2026 average for the same jurisdiction. Not seasonally adjusted.
Florida is the exception, and it confirms the rule
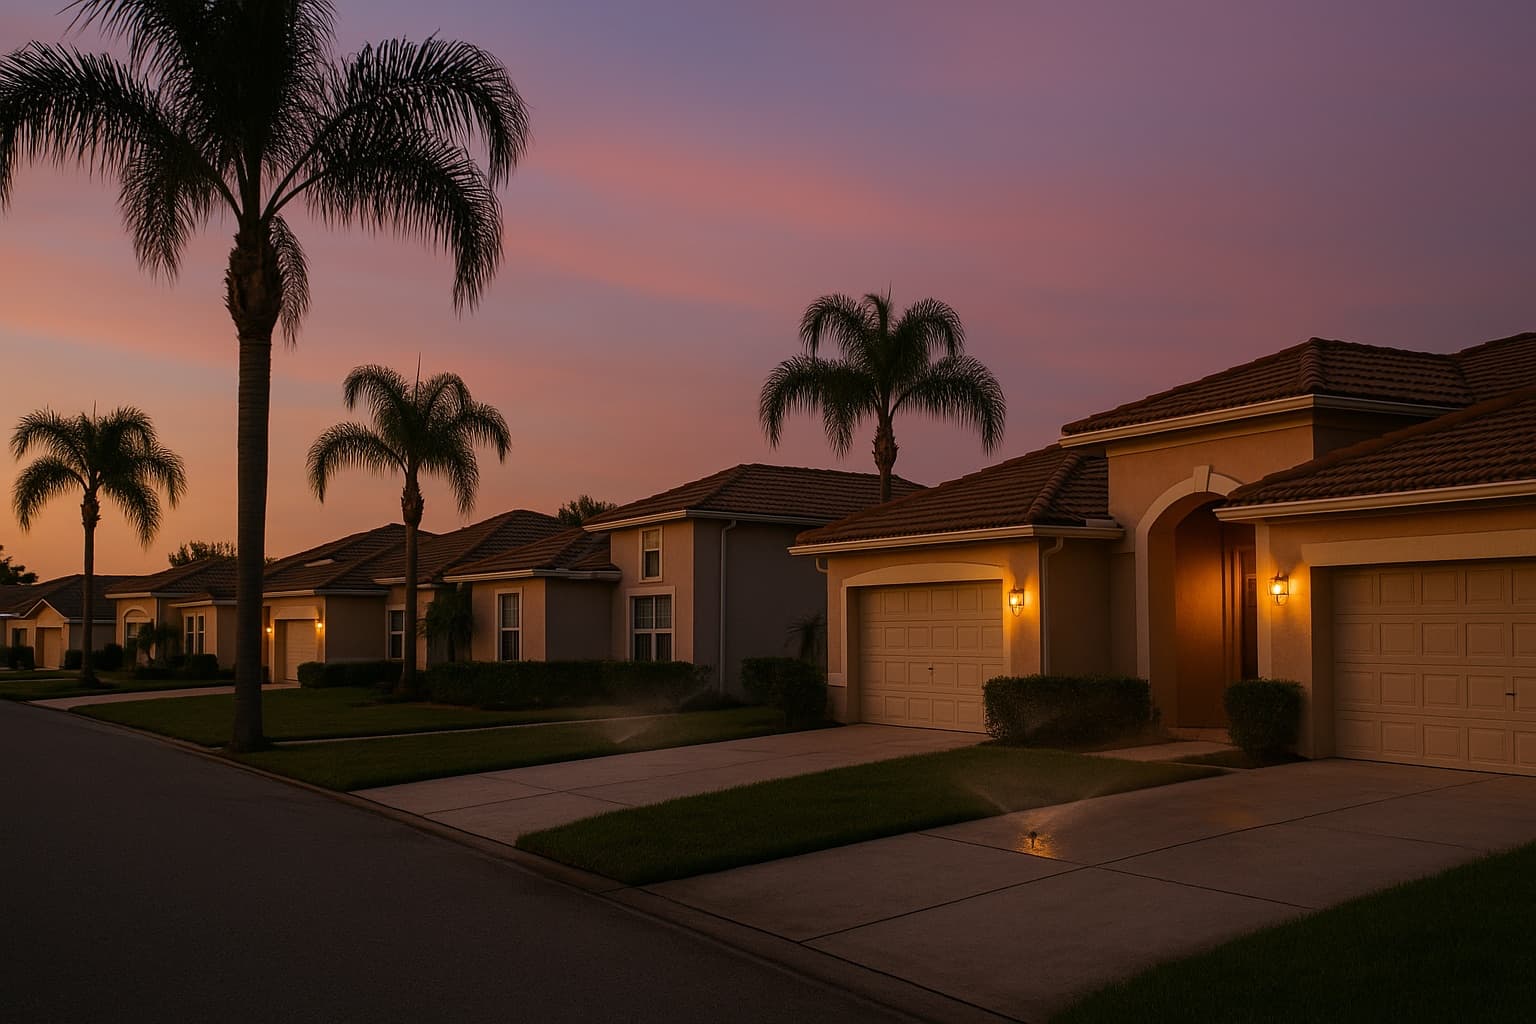
Florida still has more owner-listed homes than any other state. It also has 12.6% fewer of them than it did in April.
Florida is the largest FSBO market in the index, with 1,201 active owner-listed homes in September. It is also the only major state where the count fell meaningfully: down 12.6% since April, and still slipping (−1.4%) from August to September. Alabama (−5.5%) was the only other large market in decline, while Texas (+5.6%), Georgia (+1.7%) and North Carolina (+2.8%) were roughly flat.
That lines up with what Florida’s own data shows. Florida Realtors reported that statewide inventory fell by double digits in August, not because homes sold but because sellers pulled their listings, with the median single-family home now taking about 84 days to sell. Redfin’s September 10 analysis put the seller surplus at a record 57.9% nationally and named the Sun Belt as the driver. When a market turns against sellers, the owners selling on their own appear to be the first to retreat: they have no agent urging patience, and every extra month on the market costs them time they were not paid to spend.
September: the pool stopped growing
The six-month trend is up, but the most recent month is not. On the 31 states observed continuously in both August and September, FSBO inventory edged down 0.6% (9,328 to 9,268). That pause coincides with the sharpest move in borrowing costs this year: Freddie Mac’s 30-year fixed rate averaged 7.03% on September 24, up from 6.30% a year earlier, and existing-home sales fell 2.0% in August to a 3.98 million annual pace on 4.9 months of supply, according to the National Association of Realtors. Fewer buyers means fewer owners willing to bet they can find one without help.
What FSBO sellers are asking
The index counts listings; Landian’s seller pipeline also captures what owners are asking. Among the 669 owner-listed homes priced $400,000 and up that the pipeline captured between August 28 and September 26, the median asking price was $589,000, with the middle half of listings falling between roughly $470,000 and $850,000. Because the pipeline only tracks homes above $400,000, these figures describe the upper-middle of the market rather than the typical FSBO sale, which NAR put at $360,000 in its 2025 Profile of Home Buyers and Sellers.
| State | Listings | Median asking |
|---|---|---|
| California | 104 | $737,000 |
| Colorado | 40 | $625,500 |
| Kentucky | 39 | $599,999 |
| Washington | 47 | $599,900 |
| Virginia | 15 | $595,000 |
| Arizona | 86 | $594,000 |
| Florida | 84 | $594,000 |
| Alabama | 39 | $550,000 |
| Georgia | 39 | $520,000 |
| Louisiana | 31 | $499,985 |
| Kansas | 18 | $472,500 |
Listings priced $400K+ with 0–14 days on market at capture; states with at least 15 listings in the window.
What it means
- More owners are trying, even as fewer succeed. NAR’s 2025 Profile found FSBO transactions at a record-low 5% of sales. An index of active listings measures attempts, not closings, and attempts are up 10% since spring. The gap between the two is the story: most owners who start alone still end up hiring someone, and the ones who close alone sold for a median $360,000 against $425,000 with an agent.
- For sellers: the calculus depends on your region. In the Northeast and Midwest, a well-priced home can find its buyer without a full-commission listing. In the Sun Belt, with 58% more sellers than buyers and rates above 7%, the owners going it alone are quietly giving up. Either way, the 2024 NAR settlement means no seller has to bake a buyer-agent commission into the listing anymore, and the commission itself is negotiable in writing.
- For buyers: owner-listed homes are a larger share of what is on the market in New York, New Jersey, Michigan and Illinois than they were six months ago. Those sellers are often open to a direct offer, and with the buyer’s agent fee now set in the buyer’s own agreement, the savings on a $600,000 home can run to five figures.
- For agents: the FSBO pool is largest in Florida, New York, California and Texas and growing fastest in the Northeast and upper Midwest. Owners in this segment are pricing at a median $589,000, well above the typical FSBO sale, and most of them will need help before they close.
About the Landian FSBO Index
The index is built from daily counts of active for-sale-by-owner listings priced $400,000 to $4,000,000 as displayed on Zillow for each of the 50 US states, the District of Columbia, Puerto Rico, the US Virgin Islands, Guam and all 13 Canadian provinces and territories, captured by Landian’s coverage monitor since March 31, 2026. A jurisdiction’s monthly value is the average of its daily counts (minimum three days). Period comparisons sum only jurisdictions observed in both periods, so a missed day never registers as a change. The series is six months old, so it is not seasonally adjusted and no year-over-year comparison exists yet. Asking-price figures come from listings Landian’s seller pipeline captured in the trailing 30 days and reflect the same price band. No individual listing, address or owner is identified in this report.
For media: the full state and province tables, the monthly series and the underlying method are available on request for journalists and researchers. Email hello@landian.co with the subject “Landian FSBO Index.” Please cite as “Landian FSBO Index, September 2026” with a link to this page. The next edition publishes November 1, 2026, covering October.
Landian matches home buyers and sellers with licensed local agents at a standard fee of $4,999 per transaction, set before the client meets the agent. See how it works at landian.co.
Sources: Landian FSBO Index and seller pipeline (data through Sep 26, 2026); Freddie Mac Primary Mortgage Market Survey (Sep 24, 2026); Redfin, It’s Now the Strongest Buyer’s Market on Record (Sep 10, 2026); Realtor.com August 2026 Monthly Housing Report (Sep 2, 2026); National Association of Realtors, Existing-Home Sales, August 2026, and 2025 Profile of Home Buyers and Sellers (Nov 2025); Florida Realtors, Tight inventory helps Florida prices hold firm (Sep 2026). Landian figures are counts of active listings and asking prices, not sales, and vary by market.