
Landian Market Report · October 2026
US Owner Listings Fell 1.2% in October, and Fell Fastest Above $400,000. Rhode Island, Delaware and Puerto Rico Went the Other Way.
November 1, 2026 · Landian · The Landian FSBO Index
Key findings
- 34,897 homes are listed for sale by their owners on Zillow across the 50 states, DC and Puerto Rico as of 2026-11-01, at every price. Over October the US count fell 1.2% against the index’s late-September baseline — the same month Redfin recorded the fewest pending home sales since its records began in 2021.
- The pullback was two and a half times steeper above $400,000: US owner listings priced US$400,000–4M fell 3.0% in October, against 1.2% at all prices. Michigan’s owner listings in that segment dropped 11.7%, Louisiana’s 11.0% and Minnesota’s 15.6%.
- Rhode Island (+18.2%), Delaware (+13.3%) and Puerto Rico (+11.0%) grew their owner-listing pools against the national tide, to 46, 101 and 181 listings; West Virginia (+5.4%) and Connecticut (+5.1%) also rose. The steepest declines: British Columbia (−11.1%), Alaska (−9.3%), New Hampshire (−8.9%).
- Quebec holds 7,946 owner listings on DuProprio (every price, in C$), up 0.6% — nearly twice Florida’s 4,154, the largest US pool. Canada’s total of 11,038 slipped just 0.3% in the month CREA cut its national sales forecast for the third time this year.
- US owners above $400,000 are asking a median $619,900 (608 listings captured in the last 30 days), up from $599,000 in the September window. New York’s 59 captured listings have a median ask of $999,999 — one dollar under a million.
October was the month American sellers pulled back. The 30-year mortgage rate spent the whole month between 7.24% and 7.40% (Freddie Mac’s weekly survey, October 1–29), pending home sales sank to the lowest level in Redfin’s records going back to 2021, new listings fell to their lowest since July, and Redfin’s October 29 report showed the median US sale price down 0.1% from a year earlier — its first annual decline in three years. Sellers who could wait, waited: Redfin estimates there were 62.6% more sellers than buyers in September, the widest gap it has measured since its records began in 2013.
The Landian FSBO Index watches the sellers with the least patience for a market like that: the owners listing their homes themselves. Every day, Landian’s coverage monitor counts the owner-listed homes on the dominant for-sale-by-owner venue in each of 65 jurisdictions — Zillow’s state listings for the 50 US states, DC and Puerto Rico; DuProprio for Quebec; Kijiji’s owner-only real-estate listings for the rest of Canada — at every price, and separately from 400,000 to 4 million in local currency. This second monthly edition carries the index’s first official month-over-month readings, and they say the retreat reached the owner-listed market too, hardest at the top.
The retreat is steepest above $400,000
Across the matched US jurisdictions, owner listings at all prices fell 1.2% in October. In the US$400,000–4,000,000 segment — 9,494 of the 34,897 current US listings, about 27% — they fell 3.0%. Tennessee (−5.9%), Washington (−5.0%) and South Dakota (−4.9%) led the all-price declines among the states; in the $400K+ segment the drops ran deeper still, with Minnesota down 15.6%, Michigan down 11.7% and Louisiana down 11.0%.
That pattern — the higher the price, the faster the retreat — fits the month around it. One in five US listings cut its asking price in October (Redfin put the share at 21.7% in late October, near its record), and the National Association of Realtors, reporting September’s 3.99 million annualized sales pace on October 13, cautioned that fourth-quarter closings could be measurably down as rates climbed. An owner selling without an agent sees that market directly, in showings that don’t book and calls that don’t come, and has no listing agreement holding the home on the market. Landian’s six-month pilot series saw the same reflex in Florida, where owner listings above $400,000 fell 12.6% between April and September; in October, Florida’s official decline was a gentler 1.2% at all prices and 0.3% in the band, suggesting the earliest retreat may already be behind it.
The exceptions: Rhode Island, Delaware, Puerto Rico
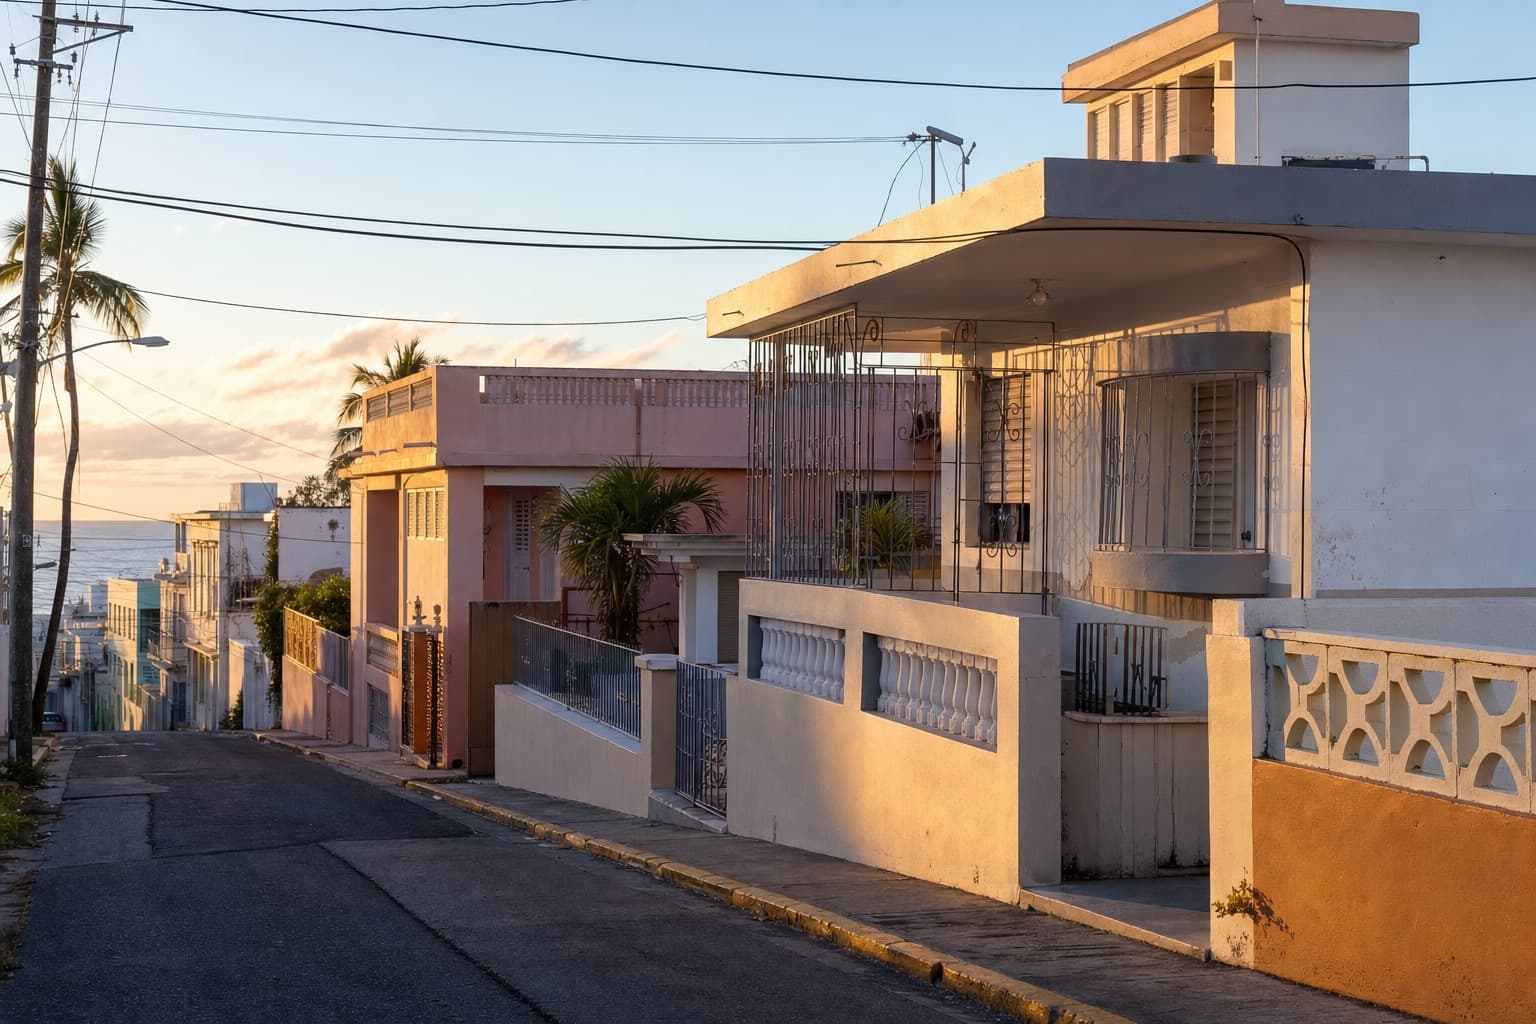
San Juan. Puerto Rico’s owner listings rose 11.0% in October, to 181 — against a 1.2% decline across the US as a whole.
Five US jurisdictions added owner listings at a meaningful rate in October, and they cluster on the Eastern Seaboard: Rhode Island rose 18.2% to 46 listings, Delaware 13.3% to 101, Puerto Rico 11.0% to 181, West Virginia 5.4% to 339 and Connecticut 5.1% to 172. These are small pools — Rhode Island’s percentage moves on a handful of homes — but Puerto Rico’s climb is not new: it was one of the twelve jurisdictions where Landian’s April–September pilot proved accurate, and the pilot had its $400,000-plus owner listings up 14.9% over those six months. In October the island’s $400K–4M segment rose another 14.1%, the largest gain of any jurisdiction with more than 40 listings.
North Carolina is the one large state that moved against the tide: up 2.9% at all prices (to 1,396, the seventh-largest pool) and up 3.2% above $400,000 — in a month NAR reported September sales falling in the Northeast and flat in the Midwest, with only the South and West rising.
Canada holds the line
Canada’s owner-listed market barely moved in the month its agent-listed market kept sliding. The index counts 11,038 Canadian owner listings as of 2026-11-01, down 0.3% over October. Quebec, the one North American market where selling without an agent is ordinary, rose 0.6% to 7,946 listings on DuProprio, and Ontario held flat (+0.1%) at 1,892 on Kijiji. The declines came from the west and the Atlantic: British Columbia −11.1% (to 157), New Brunswick −7.3% (116), Manitoba −6.8% (144), Alberta −4.2% (428).
The backdrop: CREA reported September national home sales down 7.7% from a year earlier, an average sale price of C$666,538 (−1.6% year over year), and on October 16 cut its 2026 sales forecast for the third consecutive quarter, to 444,530 homes. A DuProprio listing is close to a census of Quebec’s owner-sellers; the Kijiji counts elsewhere are a barometer, like Zillow’s in the US. Read that way, the message is that Canadian owner-sellers — most of them in the one province with real infrastructure for it — are staying put while the brokered market cools around them.
The map of owner-listed homes
The table lists every jurisdiction the index tracks, sorted by the size of its owner-listing pool, with October’s official month-over-month change for each segment. The September baseline averages the final days of that month — the official series began September 27–28, 2026 — so these first changes compare October with late September. Jurisdictions under 40 listings are shown for completeness, but their percentages should not be read as trends.
| Jurisdiction | Owner listings, all prices | October change | Priced 400K–4M | October change (400K–4M) |
|---|---|---|---|---|
| Quebec QCC$ | 7,946 | +0.6% | 5,175 | +0.6% |
| Florida FLUS$ | 4,154 | −1.2% | 1,172 | −0.3% |
| Texas TXUS$ | 2,876 | −2.4% | 651 | −2.8% |
| California CAUS$ | 1,899 | −0.6% | 1,008 | +0.3% |
| Ontario ONC$ | 1,892 | +0.1% | 1,216 | −0.1% |
| New York NYUS$ | 1,466 | −0.3% | 731 | −0.2% |
| North Carolina NCUS$ | 1,396 | +2.9% | 357 | +3.2% |
| Pennsylvania PAUS$ | 1,374 | −2.0% | 194 | −7.7% |
| Illinois ILUS$ | 1,257 | −1.4% | 179 | −4.0% |
| Michigan MIUS$ | 1,232 | −3.4% | 205 | −11.7% |
| Ohio OHUS$ | 1,160 | −3.1% | 156 | −7.5% |
| Georgia GAUS$ | 1,050 | −1.4% | 309 | −4.7% |
| Missouri MOUS$ | 1,018 | +0.2% | 175 | −1.4% |
| Arkansas ARUS$ | 970 | +1.5% | 171 | −8.4% |
| Louisiana LAUS$ | 967 | −3.6% | 118 | −11.0% |
| Arizona AZUS$ | 962 | +0.8% | 241 | −7.9% |
| Kentucky KYUS$ | 873 | −0.4% | 194 | −0.2% |
| Indiana INUS$ | 834 | −2.1% | 131 | −5.3% |
| Iowa IAUS$ | 833 | +0.1% | 175 | −4.6% |
| Tennessee TNUS$ | 828 | −5.9% | 253 | −5.7% |
| Oklahoma OKUS$ | 827 | −0.1% | 139 | −1.4% |
| South Carolina SCUS$ | 711 | −1.1% | 179 | −1.1% |
| Maryland MDUS$ | 604 | +2.3% | 100 | −2.5% |
| Colorado COUS$ | 569 | −3.8% | 231 | −3.4% |
| New Jersey NJUS$ | 551 | +0.6% | 314 | −1.9% |
| Virginia VAUS$ | 520 | −2.6% | 166 | −0.3% |
| Mississippi MSUS$ | 442 | −0.3% | 104 | −0.2% |
| Alabama ALUS$ | 432 | — | — | — |
| Alberta ABC$ | 428 | −4.2% | 149 | −7.7% |
| Oregon ORUS$ | 423 | −0.8% | 196 | −3.8% |
| Kansas KSUS$ | 392 | −0.6% | 54 | −7.1% |
| West Virginia WVUS$ | 339 | +5.4% | 58 | −2.2% |
| Nebraska NEUS$ | 333 | +1.4% | 85 | −3.7% |
| Minnesota MNUS$ | 324 | −4.7% | 86 | −15.6% |
| Nevada NVUS$ | 302 | −1.9% | 112 | −4.8% |
| New Mexico NMUS$ | 284 | −0.9% | 70 | −7.5% |
| Utah UTUS$ | 280 | −2.4% | 158 | −3.1% |
| Idaho IDUS$ | 275 | −3.1% | 148 | −4.9% |
| South Dakota SDUS$ | 218 | −4.9% | 47 | −10.2% |
| Washington WAUS$ | 218 | −5.0% | 124 | −5.8% |
| Puerto Rico PRUS$ | 181 | +11.0% | 86 | +14.1% |
| Saskatchewan SKC$ | 176 | −2.8% | 33 | −14.1% |
| Connecticut CTUS$ | 172 | +5.1% | 79 | +6.9% |
| Massachusetts MAUS$ | 170 | −6.8% | 97 | −9.0% |
| Montana MTUS$ | 163 | −4.3% | 83 | +1.2% |
| British Columbia BCC$ | 157 | −11.1% | 86 | −4.7% |
| Manitoba MBC$ | 144 | −6.8% | 43 | −9.7% |
| Maine MEUS$ | 139 | +1.9% | 50 | +1.7% |
| Hawaii HIUS$ | 133 | −2.5% | 73 | −0.1% |
| Wyoming WYUS$ | 123 | −2.4% | 46 | +4.1% |
| Vermont VTUS$ | 122 | +2.2% | 38 | −6.8% |
| Nova Scotia NSC$ | 119 | −4.0% | 29 | +13.8% |
| New Brunswick NBC$ | 116 | −7.3% | 16 | −28.5% |
| North Dakota NDUS$ | 111 | −5.7% | 24 | −8.6% |
| Delaware DEUS$ | 101 | +13.3% | 30 | +1.2% |
| Alaska AKUS$ | 91 | −9.3% | 28 | −23.7% |
| District of Columbia DCUS$ | 81 | −2.3% | 25 | −10.8% |
| New Hampshire NHUS$ | 58 | −8.9% | 21 | −8.7% |
| Rhode Island RIUS$ | 46 | +18.2% | 22 | +29.6% |
| Newfoundland and Labrador NLC$ | 25 | −14.8% | 3 | −39.6% |
| Prince Edward Island PEC$ | 24 | −17.7% | 11 | −9.0% |
| Wisconsin WIUS$ | 13 | +8.1% | 1 | −64.5% |
| Yukon YTC$ | 10 | +54.3% | 5 | +85.8% |
| Northwest Territories NTC$ | 1 | 0.0% | 0 | — |
| Nunavut NUC$ | 0 | — | 0 | — |
Counts are the latest daily observation (2026-11-01). US$ for US jurisdictions, C$ for Canadian ones; the 400K–4M band is in each jurisdiction’s own currency. October change compares each jurisdiction’s October average of daily counts with its late-September baseline; “—” means too few September observations for a comparison. Alabama’s 400K–4M segment was not observed in October. Wisconsin reads low because Zillow carries only a handful of owner listings there; Wisconsin owners mostly use local FSBO sites. Not seasonally adjusted.
What FSBO sellers are asking
The index counts listings; Landian’s seller pipeline also captures what US owners are asking in the $400,000-plus segment. Among the 608 owner-listed homes the pipeline captured between 2026-10-03 and 2026-11-01, the median asking price was $619,900 — up from $599,000 in the September window — with the middle half of listings between $490,000 and $885,000. The standout is New York, where the median ask across 59 captured listings is $999,999: owner-sellers pricing one dollar under the million mark, in the month the median US home sold for $417,500 (NAR, September). Because the pipeline only tracks homes above $400,000, these figures describe the upper-middle of the market rather than the typical FSBO sale, which NAR put at $360,000 in its 2025 Profile.
| State | Listings | Median asking |
|---|---|---|
| New York | 59 | $999,999 |
| New Jersey | 26 | $749,000 |
| California | 30 | $730,000 |
| Michigan | 16 | $674,450 |
| North Carolina | 16 | $655,000 |
| Oregon | 18 | $637,500 |
| Arkansas | 19 | $628,000 |
| South Carolina | 19 | $598,500 |
| Arizona | 42 | $598,500 |
| Florida | 36 | $587,450 |
| Texas | 58 | $567,500 |
| Illinois | 21 | $509,900 |
| Pennsylvania | 18 | $507,500 |
| Oklahoma | 19 | $494,500 |
US listings priced $400K+ with 0–14 days on market at capture; states with at least 15 listings in the window.
What it means
- For sellers: October’s numbers say the sellers most exposed to the market — owners listing alone, above $400,000 — are withdrawing two and a half times faster than owner-sellers overall. With rates above 7.2% all month and one in five listings cutting its price, the sellers still standing are competing on price and patience. The 2024 settlement means every commission is negotiable in writing, and no seller has to bake a buyer-agent fee into the listing.
- For buyers: 34,897 US homes and 11,038 Canadian homes are being sold directly by their owners right now, and the owners who kept their listings up through October’s retreat have signalled they intend to sell. In the deepest buyer’s market Redfin has measured, a direct, documented offer to an owner-seller is a strong position.
- For agents: the largest owner-listing pools are Quebec (7,946), Florida (4,154), Texas (2,876), California (1,899), Ontario (1,892) and New York (1,466) — and the growth is in Rhode Island, Delaware, Puerto Rico and North Carolina. US owner-sellers above $400,000 are asking a median $619,900, and NAR’s data says most who close will have needed help along the way.
About the Landian FSBO Index
The index is a daily count of active for-sale-by-owner listings, taken from the dominant owner-listing venue in each market: Zillow’s own state listings (not a map rectangle) for the 50 US states, the District of Columbia and Puerto Rico; DuProprio for Quebec and Kijiji real estate with the for-sale-by-owner filter (houses and condos) for the other provinces, Yukon and the Northwest Territories, with Nunavut taken as Kijiji’s Territories total minus Yukon and the NWT. Every jurisdiction is counted at all prices and again in the 400,000 to 4,000,000 band in local currency. Guam and the US Virgin Islands have no usable source. No listing details are collected; every figure is a count or an aggregate, and no address, owner or photo is identified. The official series began September 27, 2026, so this edition’s month-over-month figures compare October’s average daily counts with a baseline drawn from the final days of September. A jurisdiction’s month enters the series once it has at least three daily observations, and period comparisons sum only jurisdictions observed in both periods. The index is not seasonally adjusted and has no year-over-year comparison yet; year-over-year figures arrive when the series turns 13 months old, in late 2027. Zillow carries very few owner listings in Wisconsin, so that state reads low.
Coverage: the US count is a barometer of publicly marketed owner listings on the dominant public FSBO venues, not a census of every private sale. NAR’s 2025 Profile of Home Buyers and Sellers puts for-sale-by-owner deals at 5% of US sales — a record low — and reports that 60% of those sellers already knew their buyer and about one in ten used a listing aggregator such as Zillow. DuProprio, by contrast, is where most Quebec owner-sellers list.
The pilot: from March 31 to September 27, 2026, Landian counted Zillow owner listings priced $400,000 and up inside a bounding rectangle around each jurisdiction. Rectangles overlap neighbours, so the pilot is reported only for the 12 jurisdictions where its count matched the exact state count within 10% — Arizona, Colorado, Florida, Hawaii, Kansas, Maine, North Dakota, New Mexico, Puerto Rico, South Dakota, Utah, Wyoming — and never for Canada, where Zillow has no owner-listing inventory.
For media: the full jurisdiction table, the daily series and the method are available on request for journalists and researchers. Email hello@landian.co with the subject “Landian FSBO Index.” Please cite as “Landian FSBO Index, October 2026” with a link to this page. The next edition publishes December 1, 2026, covering November.
Landian matches home buyers and sellers with licensed local agents for a flat fee set by the home’s price, not a percentage. See how it works at landian.co.
Sources: Landian FSBO Index and seller pipeline (counts as of 2026-11-01; asking prices 2026-10-03 to 2026-11-01); Freddie Mac Primary Mortgage Market Survey (Oct 1, 8, 15, 22 and 29, 2026); Redfin, US Pending Home Sales Sink to a New Low (Oct 22, 2026), US Home Sale Prices Fall for the First Time in Three Years (Oct 29, 2026) and its September seller–buyer gap estimate (62.6%, reported October 2026); National Association of Realtors, Existing-Home Sales, September 2026 (Oct 13, 2026) and 2025 Profile of Home Buyers and Sellers (Nov 2025); CREA, September 2026 national statistics and revised 2026 forecast (Oct 16, 2026). Landian figures are counts of active listings and asking prices, not sales, and vary by market.